By John Richardson
DEMAND, as I discussed on 11 February, will not be a problem for the global polyethylene (PE) business in 2021.
We could see a continuation of the pandemic-related demand patterns we saw in 2020 if say problems with variants of the virus prevent us from moving significantly closer to herd immunity.
The outcome we all hope for is a big step towards herd immunity. We would then see a cycle out of stronger demand for some of the goods we have seen during the pandemic – such as hygiene products, electronics and white goods – and into “old world” services like restaurants and travel.
Either outcome would make no difference to PE demand. Consumption may continue to be buoyed by our pandemic lifestyles. Or we could see a recovery in consumption linked to restaurants and travel that would compensate for the loss of volumes elsewhere.
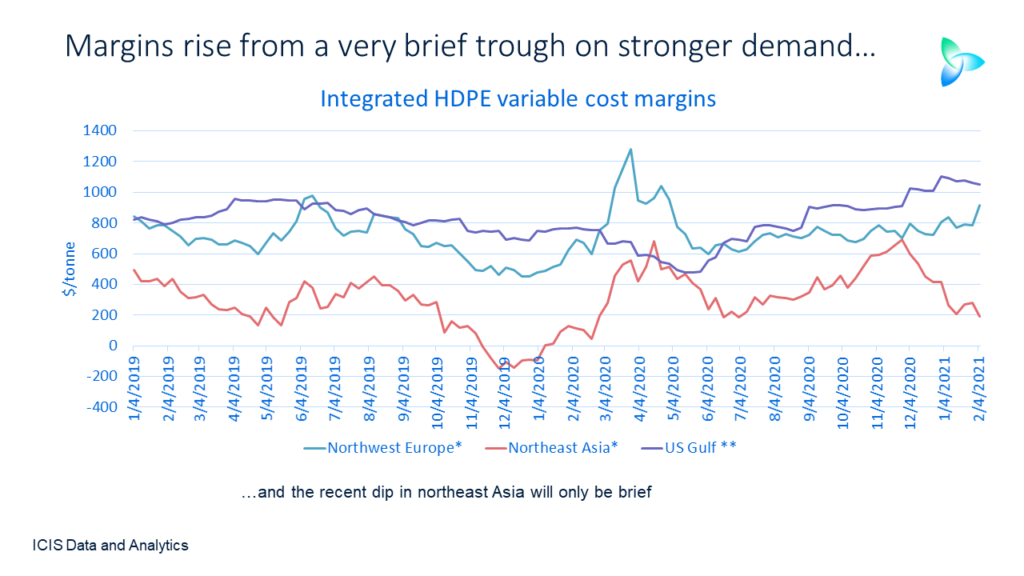
As little as 14 months ago, at the end of 2019, Asian integrated naphtha-based PE margins had turned negative on US-driven oversupply. But such has been the uplift to demand since then that any further supply-driven downcycle will, I believe, be a mild event. We might even get away without another downcycle.
The above chart, using the example of integrated naphtha and ethane-based high-density (HDPE) margins, illustrates how profitability has bounced back since late 2014 in Europe, northeast Asia (NE Asia) and the US. It is the same story with low-density PE (LDPE and linear-low density PE (LLDPE) margins.
Note that I see the recent fall in NE Asia margins as temporary, as it is the result of a moderate Q1 slowdown in China that should be reversed in the second quarter.
Some of the recovery in margins has been due to supply constraints as well as stronger-than-expected demand.
But I believe the bigger story is a secular shift in demand. Even assuming no delays to the aggressive capacity expansions planned for 2021, global operating rates seem likely to be higher than our base case predictions. Ergo, this would have to be the result of the new demand paradigm.
Let me give you an example, using my upside demand scenarios from the 11 February post. Our base case for global LLDPE demand in 2020-2021 is 79.8m tonnes, resulting in 2020 and 2021 global operating rates of 85%.
I see demand instead reaching 82.8m tonnes in 2020-2021. This would result in operating rates during both years at 90%. As we all know, higher the operating rates indicate stronger industry profitability.
The scheduled 2021 capacity increases, as mentioned above, are big – especially in China and the US. In China, for instance, HDPE capacity is forecast to rise by 24% over 2020 to 12.2m tonnes/year this year. We expect LDPE capacity to increase by 7% to 3.2m tonnes/year and LLDPE by 15% to 10m tonnes/year.
As I again highlighted on 11 February, some 70% of global PE demand is in the developed world and China. It is in these regions where I see upsides for growth as the rest of the world struggles.
I continue to worry about vaccine nationalism and the impact on poorer countries of a lack of adequate access to vaccines. But in hard-hearted dollars and cents terms, a bad outcome for vaccinations in Africa and poorer parts of Asia & Pacific etc would make little difference to global PE consumption.
Outcomes for Chinese HDPE imports in 2021
Crucially, also, I only see a decline in China’s HDPE imports in 2021 versus last year. LDPE and LLDPE imports will increase. Why this is crucial is because China dominates global PE import markets.
Let me start here with my two scenarios for HDPE imports in 2021 before I move onto the chart at the beginning of this section, showing what would be the impact on China’s top 10 HDPE trading partners.
Note that I’ve expressed imports in tonnes in the charts in this post to make them easier to read. In the text, imports are expressed in millions of tonnes.
Last year’s HDPE imports were 9.1m tonnes. My first scenario for 2021 assumes demand growth at 7%, a significant decline from last year’s growth of 14%.
This reflects my view that China’s economy will see a mild deceleration in Q1, the result of the global container freight and semiconductor shortages and a limited second wave of the pandemic in China. It is a similar story in LLDPE. But in the case of LDPE, as you can read below, I see a recovery from negative growth in 2020.
My first scenario for HDPE also assumes an average local operating rate of 92%, the same as last year. This would result in 2021 imports declining to 8.1m tonnes.
Under my second scenario, I again assume 7% demand growth but raise the operating rate to 95% – the average actual rate in 1999-2019. This would leave this year’s imports at 7.7m tonnes.
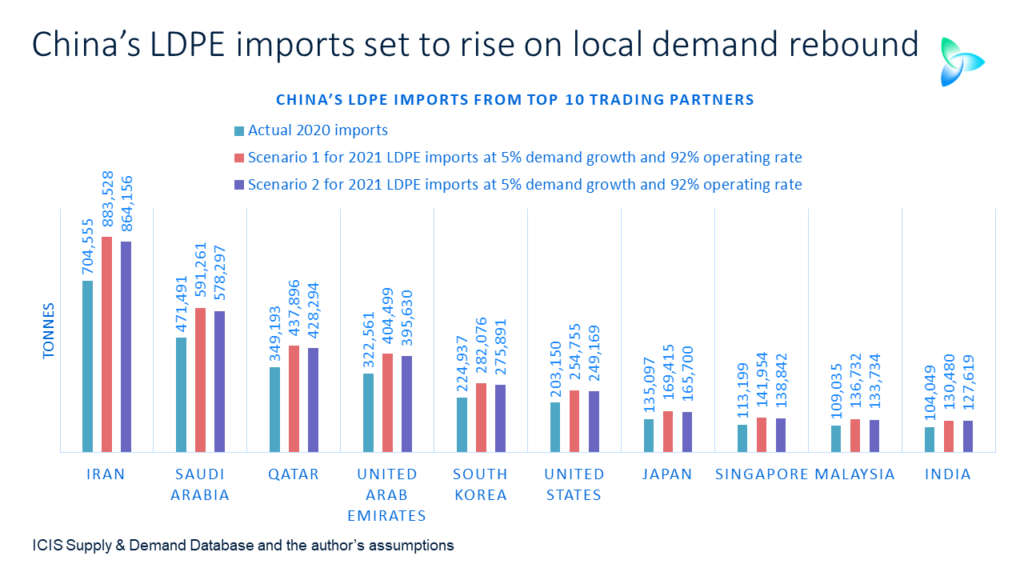
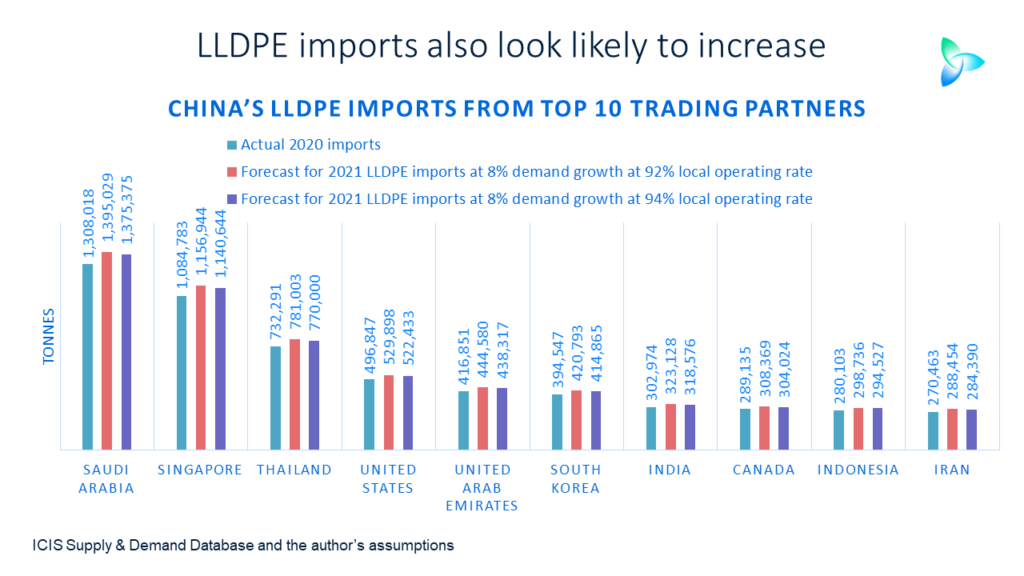
Assuming China’s top 10 trading partners gain the same percentage shares of total imports in 2021 as they did in 2020, the results are in the chart at the beginning of this section.
Under Scenario 1, China would import 1.8m tonnes from Saudi Arabia in 2021 compared with 2m tonnes last year. Scenario 2 would see imports slip to 1.7m tonnes.
United Arab Emirates, in second place, would see imports slip to 1.1m tonnes under Scenario 1 and 1m tonnes under Scenario 2. This would compare with 1.2m tonnes in 2020.
None of the declines would be a big deal because of a healthy global market; the missing volumes could easily be sold elsewhere.
LDPE imports in 2021 look set to increase
China’s LDPE demand growth slipped by 2% in 2020, the result of much more ample supply of LLDPE. LLDPE can, of course, be used in many of the same end-use applications as LDPE.
Last year’s LDPE imports declined by 7% to 3.4m tonnes. But I see imports increasing in 2021 under both my scenarios because of a return to positive demand growth as LDPE will become more affordable due to increases in supply
US capacity is set to jump by 18% over last year to 4.4m tonnes/year with as Chinese capacity increase by 7% to 3.2m tonnes/year. These are big increase relative to the size of LDPE demand.
I expect Chinese consumption to therefore this year increase by 5%, in line with long-term average growth on LDPE. This would, as I said, be the result of LDPE becoming more affordable versus LLDPE.
Last year’s average China LDPE operating rate was 92%. Assuming 5% growth and a repeat of this operating rate in 2021, imports would rise to 4.3m tonnes. If the operating rate reached 95% – which is again the 1999-209 average and growth was also 5% – imports would be 4.2m tonnes.
In case I blind you with too many numbers (I may well have gone beyond this point already), I am not going to give examples from the chart at the beginning of this section. But as you can see the gains made by China’s top LDPE impot partners would be significant.
The outlook for LLDPE imports is also rosy 
Chinese LLDPE demand jumped by an astonishing 14% in 2020. For the reasons described above, I see growth moderating to 8% in 2021.
It is the other way around for LLDPE because of how the numbers work out. Scenario 1 for 2021 is built on the average 1999-2019 operating rate of 92% as this is the lower figure.
Assuming 8% growth, this would leave this year’s imports at 7.1m tonnes versus 2020’s 6.7m tonnes. If you use last year’s operating rate of 94% and keep growth at 8% imports would decline to 7m tonnes.
You can again refer to the chart at the start of this section. There would be slight but still useful gains under both scenarios for China’s top 10 LLDPE trading partners.
The story is nowhere near as rosy elsewhere. In fact, in the cases of polypropylene (PP) and styrene monomer (SM) their outlook for 2021 looks very bleak. This will be despite what I also see as resilient demand growth in all the products.
My 4 February post on paraxylene detailed the possibly that overall imports could fall by 58% this year versus their all-time high in 2018. The post also detailed would be the impact on China’s top ten trading partners.
China will this year be much closer to fulfilling its ambition of complete self-sufficiency in these polymers and petrochemicals. This was an ambition that should have been clear to everyone since 2014, the year in which China announced a major policy shift.
Surprisingly, also, ethylene glycols (EG) imports may also fall by around 50% this year versus 2020, assuming quite high local operating rates and even with robust demand growth.
In later posts, I shall consider the implications for the overall 2021 imports of of PP, SM and EG and the impact on China’s major trading partners.
This will complete by first round of coverage of China’s biggest petrochemicals import markets in 2021. I will provide updates on the outlooks as the year further progresses.
